AIMLIGHT® calculates the photometric data directly from the input parameters or from external created reflector-coordinates.
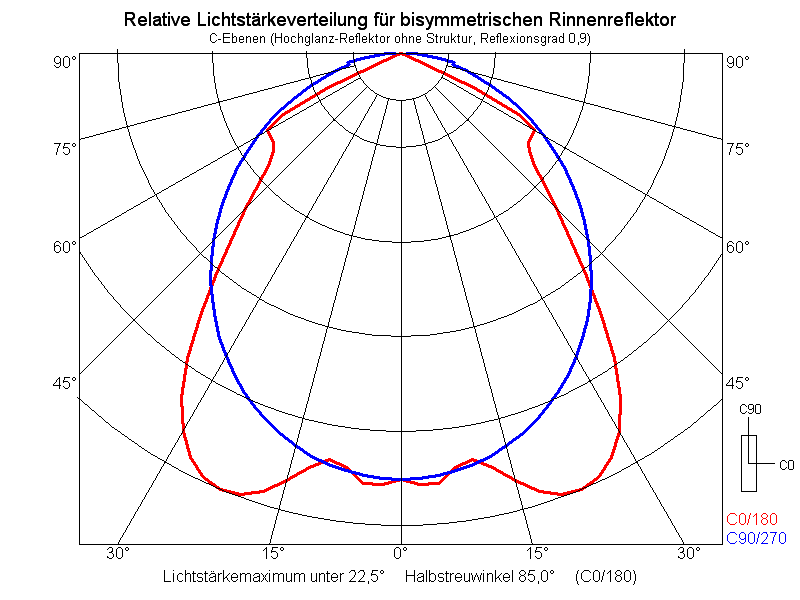
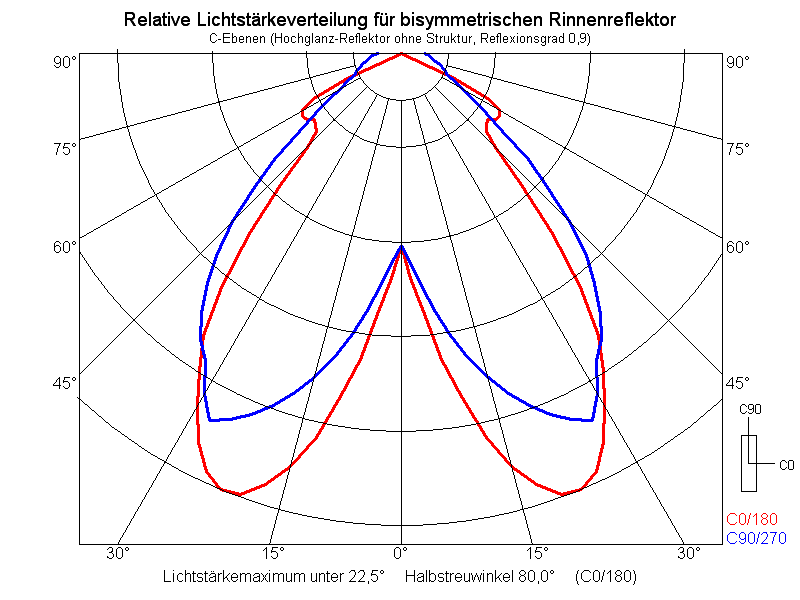
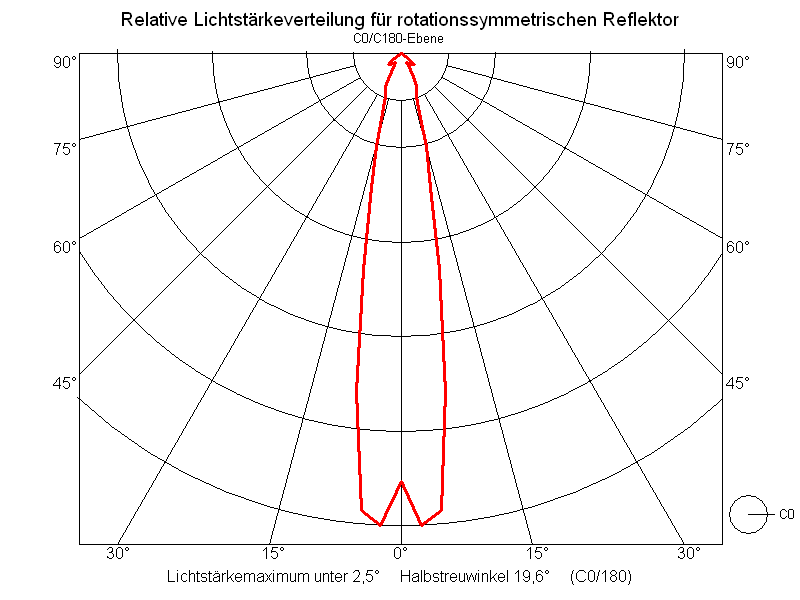
For symmetrical trough-shaped reflectors and rotationally symmetrical reflectors, the light
intensity distribution can be shown in a polar diagram (C-planes) and as a luminous intensity table in angle increments of 2.5° for the radiation area from 0° to 90°.
The radiation angle for the light intensity maximum and the half-peak
divergence are shown.
The photometric analysis can be compared with a Goniophotometer-measurement.
The light intensity can be saved and printed out.
When calculating the light distribution AIMLIGHT® analyzes up to 1.3 million light beams that emerge from any point of the body of the light source and are reflected by the reflector surfaces in order to ascertain the light intensity for the vertical angles (0° to 90°).
The light intensity distribution is calculated for directed and distributed reflections.
In the following part of this page you see six examples of light intensity distributions which were calculated by AIMLIGHT®. If you want to see a magnification of an image, please click on it once with with the left mouse button. A new window will be opened where you can see the image in real size.
For more screenshots please visit this page. |